Cybit and TD Synnex Live Webinar: Reaching New Heights with Copilot for Microsoft 365
Join us for our live webinar – “Reaching New Heights with Copilot for Microsoft 365” Are you ready to take
Read articleBefore Cybit, I worked with a Housing Association where the first Monday of every month I had to run our financial reports – a day later and all our financials would be skewed. We couldn’t gain visibility of arrears, so we often had to write off thousands of pounds of debt, rather than go to court.
We had houses that weren’t being rented and we didn’t know why or what to do about it. We had separate systems to manage repairs, maintenance, assets, arrears, financials, and internal data – and no way to see it all in one place. All of this valuable, rich data, and no way to understand it, never mind take advantage of it.
Several years later, and for a lot of Housing Associations I’ve worked with to implement analytics, these problems haven’t gone away.
Often, Housing Associations suffer from what’s known as ‘data chaos’ – with data that is separate, incompatible, and hard to blend and manage.
There is no one big provider of ‘housing’ tech that covers all of a Housing Association’s needs, so often we find HAs have a multitude of systems, or highly bespoke software. But this doesn’t fit all of their demands – or it might when it’s first implemented, but then things change and technology progresses and then it’s suddenly outdated. If you think of the amount of legislation and compliance involved with housing, it can be very difficult to roll with the times.
You might have systems for internal staff (HR, payroll, marketing), your properties (asset management) and for external contractors (servicing, repairs, maintenance). That is a lot of data to keep track of and to understand.
Think about a problem you’re currently experiencing. For example, you have a lot of empty properties – why? Is it because there’s a performance issue in your team, or is it that no one wants two bedroom properties in a certain area? These are the questions you need the answer to.
That’s where analytics comes in. You probably have a lot of different systems with all of this information in separately, and it’s hard to get an overview.
Your main priorities are likely arrears, repairs, and void/empty properties – so let’s look at how analytics can help.
To go back to my example of empty properties, while knowing why that’s happening, what’s more important is discovering what to do about it. How can you help your team perform better, or what do people want, and how can you offer what they want and make more money? These are the answers that true data analytics can give you.
Why Housing Associations Adopt Analytics
Normally I find the trigger for most HAs deciding to implement analytics is after something goes wrong. They’re haemorrhaging money, a vital repair was ignored, a crucial problem with a house was missed. Some companies do proactively adopt analytics to gain the competitive edge and get the answers they need faster, too.
HAs want to use analytics to find problems before they happen to mitigate them proactively, and find new business opportunities and act before it’s too late.
HAs want to achieve:
Let’s take a look at the key focus areas for HAs, the current problems, and how analytics can help.
Arrears
You want to avoid current and former arrears. It’s very difficult recovering owed money once someone moves out, and you certainly want to avoid writing off debt because it’s easier than chasing.
With analytics tools, for example Alteryx, you can use profiling to identify tenants who are a high risk of falling into arrears. Of course, this has to be done accurately and in a non-biased way. But you feed Alteryx all your data and it will identify the key factors, whether that’s geographic or demographic, as to what makes someone high risk for falling into arrears, helping you to flag them as high risk.
This isn’t a targeting exercise; you can use this information to perhaps help them with payment plans or reminders to prevent them falling into arrears.
You have to be careful because, for example, the local populace demographic of Newcastle will be wildly different to London so the data might get skewed if it isn’t set up properly.
Empty/Void Properties
Any empty properties you have is missed revenue. You need to understand why a property is void, and what you can do about it.
But then this also goes hand-in-hand with repairs because a property has to be fit for purpose before someone else moves in. Analytics can help tie these systems together so you can gain an understanding of what repairs and maintenance needs to be done and when it needs to be done.
Servicing, Maintenance and Repairs
You’ve got planned work, responsive work, and cyclical work – that’s a lot to keep on top of. I worked with a HA that serviced 7,000 different gas boilers every year, across the country. Of course, this is of tantamount importance because if a boiler explodes and someone gets hurt – or worse, you’re liable. That’s a huge amount of risk.
With analytics, you can set up an overview and more detailed views of services and repairs that need to happen, the percentage that are in progress, scheduled, completed, overdue, first time fix rates, where they are geographically located, and anything else you need to visualise.
You could then provide secure access to that dashboard to your outsourced contractor company so they can see all the information they need to get the job done in a timely manner.
Marketing
You want to find out what people are saying about you on social media, and whether there is more you can do to engage with your tenants online.
With solutions like Qlik you can have APIs to pull your social media data directly into a dashboard (rather than manually entering the info into Excel or similar) which is great if you want to combine data from multiple related accounts and hashtags, or to analyse yourself vs. competitors.
You could analyse sentiment – whether users feel positively or negatively about your company – or find new ways of using social media as a customer service/support tool, for example.
Property portfolio
Currently it probably takes a lot of manual work to understand the properties you have, why some are empty, what you can do about it, and what properties you should be investing in.
Analytics can help you understand all of this – in one interactive, easy to understand dashboard. You can pull in any available third-party demographic, geographic, and socioeconomic data to help you decide next steps.
What is stopping Housing Associations from adopting analytics?
I know that for many Housing Associations, change is scary. You worry about adoption of a new tool, whether it will be worth your time and effort – because if it’s a failure, it’s on your head.
Another worry I hear a lot from the Business Intelligence (BI) or performance teams before we work with them, is that we’re going to take their jobs. It’s simply not the case, we’re there to enable the team, to help them gain new skillsets, deliver better value to your organisation, and to be able to build their own dashboards and set up their own visualisations. The tools are there to help them stop being a report builder, and instead to become the BI analyst they’re paid (and want!) to be.
That’s part of why I created a dashboard to help Housing Associations, as I have experienced and seen first-hand the problems they face, understand what they’re trying to achieve, and empathise with the worries they face. I want HAs to get up and running quickly with analytics, and with less risk. Let’s take a look…
Housing Associations Analytics: Starter App
To combat these worries HAs often have about analytics, and help to prove the value of analytics before investing a huge amount into it, I’ve created a ‘starter app’ visualisation dashboard that can quickly pull in your data so you can see for yourself how it will help you.
Guided analytics helps you understand the ‘why’ behind your data, but true self-service data exploration like Qlik is how you gain the ‘what we can do about it’ part.
Quickly Get Started with Transformative, Value-Add Analytics
The Qlik dashboard I’ve built is plug and play for MIS Active Management Systems users, so we can provide you with a Proof of Concept licence, and in one day we can quickly get your data organised and pulling through into the dashboard.
It visualises data about empty properties, servicing, current and former arrears (amount/percentage of total rent), repairs, void properties. All in a range of visualisations like bar charts, pie charts and geospatial analytics, so your data isn’t skewed with the wrong type of visualisation.
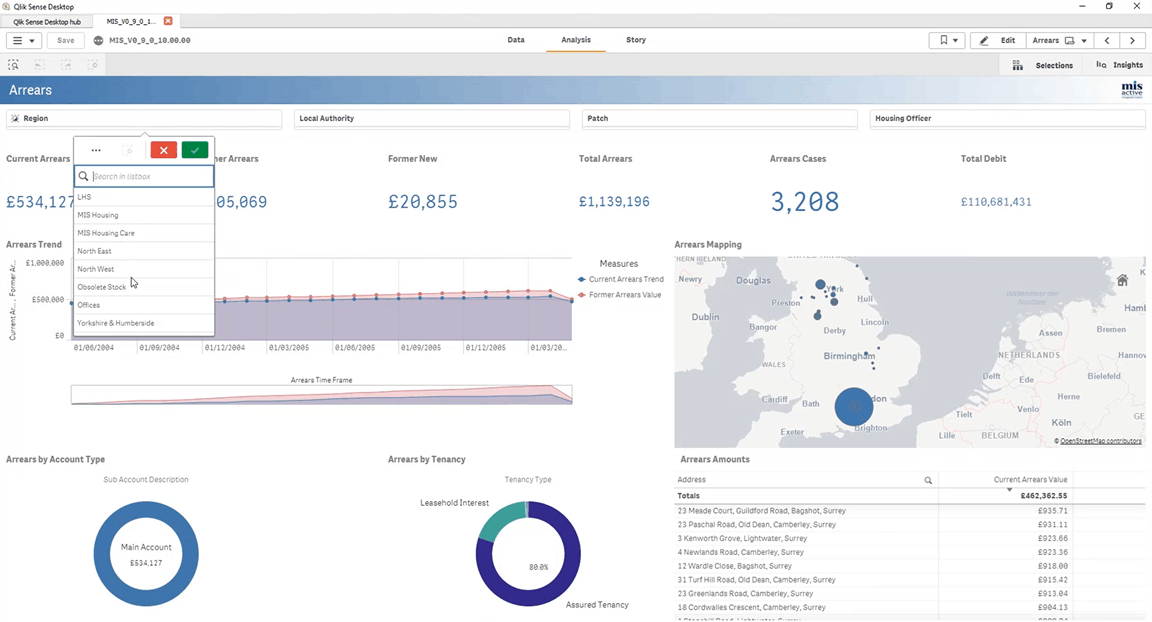
With Qlik, you also have the option of setting up the architecture so internal staff AND external partners can access dashboards to share insights and improve performance.
For example, our customer Nexus allow third-party engineers (maintenance and safety audits for the Tyne & Wear Metros) to access the same dashboards their staff use. Rules are set up on the Qlik architecture to allow access to certain geographic addresses (different data is displayed for the Nexus office and external). You can choose from a huge variety of access and security configurations.
A Phased Adoption: Gain Skills & Self-Sufficiency
You can do a phased approach to moving over your data from one system to another, one dashboard at a time.
This plug and play dashboard gives you a base, where we can get you up and running with building your own dashboards on top of this for other more specific requirements. We’ll get you to be self-sufficient in building your own reports and dashboards. Once you’ve got the skills to do that, the world is your oyster.
Get in touch for a free consultation about next steps and getting started with this dashboard.
Let me give you two examples of cool things Housing Associations can do using advanced analytics:
Predictive analytics
By using predictive analytics, you can predict which tenants are likely to fall into arrears. Or for your properties, you could predict repairs or the property’s lifespan.
Geospatial analytics
With geospatial analytics, you could import custom map types, like Ordnance Survey maps, or create custom maps. You could split maps into custom areas, like your neighbourhoods, or postcodes. For example, with one of our Housing Association customers, we’re going to use Qlik GeoAnalytics to visualise their bespoke patches of properties – not counties or areas – and visualise flood planes.
Here are the key points from this article:
Contact us today for a chat about anything discussed in this article.
We understand there are many options to choose from and you want to make sure the tool you adopt is the right one for you.
"*" indicates required fields
Construction in Crisis! Written by Chrissie McAnelly, Cybit Data & Analytics Consultant – Construction Sector The construction sector is
Read articleBy Asiel Esgair – Cybit Data & Analytics Consultant – Public Sector & Local Authority In our
Read article